Key Points
- Top Underground Station: Tottenham Court Road secured its place as the busiest London Underground station in 2025 based on specific local metrics, drawing 63.4 million passengers.
- Network Giants: In an alternative dataset, King’s Cross St Pancras registered 72.5 million overall users, while Waterloo held second place with 69.8 million entries and exits.
- Elizabeth Line Leader: Bond Street proved to be the most popular hub on the Elizabeth line, accommodating 42.4 million passengers throughout the year.
- DLR and Overground Peak: Canary Wharf led the Docklands Light Railway (DLR) network with 6.1 million users, while Shepherd’s Bush topped the London Overground tables at 6.7 million.
- The Quietest Extremes: Essex’s Roding Valley recorded the lowest usage across the entire Tube network, while Buckinghamshire’s Iver station was identified as the least used stop on the Elizabeth line.
- Raw Tap Data Utilised: The underlying data, sourced via a Freedom of Information Act (FOI) request, tracks real entry and exit turnstile taps rather than historic annualised mathematical models.
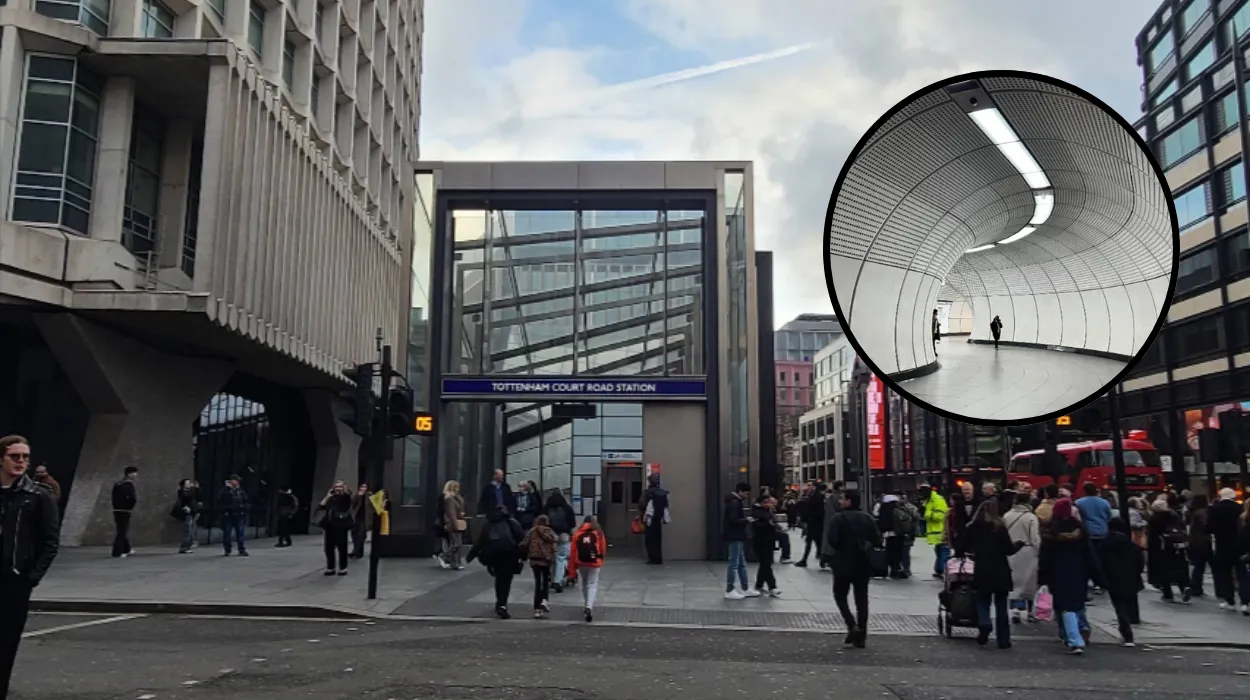
London (Extra London News) May 22, 2026 – Transport for London (TfL) has officially unveiled the definitive passenger transit figures for 2025, laying bare the post-Elizabeth line travel choices of millions of daily commuters. The newly published data, retrieved via a comprehensive statutory freedom of information inquiry, highlights an unprecedented realignment of passenger footfall throughout the capital. At the core of these fresh operational revelations is the dramatic transformation of the West End’s transit ecosystem. Tottenham Court Road has achieved a historic milestone by ranking as the single busiest interchange on the traditional London Underground network under specific localized metrics, processing an astonishing 63.4 million entries and exits over the twelve-month tracking period.
The extensive figures reveal that the rapid expansion and integration of the high-speed Elizabeth line have fundamentally reshaped how commuters navigate Zone 1 and the outer suburban fringes. According to the data released by the network’s planners, Tottenham Court Road—which services both the deep-level Northern and Central lines alongside its massive new subterranean Elizabeth line complex—has seen its passenger volume skyrocket. However, when looking at total raw interchange volumes across separate macro-level datasets, the historic northern gateway of King’s Cross St Pancras managed to retain its broader network dominance, logging 72.5 million individual taps, closely followed by the south-bank powerhouse of Waterloo station at 69.8 million.
Which Tube Station Tops the Commuter Charts?
As detailed by Transport for London’s analytical publishing team, the performance of individual central London ticket halls has been heavily impacted by the consolidation of east-west cross-rail paths. While historic thoroughfares like Oxford Circus traditionally held unmatched dominance, the sheer capacity of infrastructure upgrades has re-routed the flow of retail and office commuters alike.
The figures show that Tottenham Court Road’s 63.4 million individual turnstile actions have solidified its status as an elite transport hub. Conversely, the public transport body confirmed that the absolute quietest corner of the London Underground remains Roding Valley. Located on the outer boundary of the Central line within the county of Essex, the tranquil suburban station serves as a stark polar opposite to the frantic, brightly lit ticket halls of the West End.
Explore More London Local News
Southern Trains Delayed Between East Croydon and Oxted: 2026
Southern Trains Cancelled This Sunday: East Croydon Travel Disruption 2026
How Did the Elizabeth Line Impact Station Usage?
Since its historic opening, the Elizabeth line has continued to shatter internal passenger projections, shifting millions of journeys away from older legacy deep-tube routes. According to the FOI responses compiled from the automated electronic ticketing architecture, Bond Street has emerged as the clear jewel in the crown for the purple-branded network.
The fashionable shopping and commercial district hub handled 42.4 million independent entries and exits over the course of 2025, outpacing several purpose-built transport interchanges along the same route. At the opposite end of the logistical spectrum, Iver station, located in rural Buckinghamshire, holds the distinction of being the least utilised asset on the entire Elizabeth line infrastructure, proving that suburban commuter habits remain highly centralized around core urban zones.
Which Stations Dominate the DLR and London Overground?
The peripheral rail systems that circle and support the financial districts have also seen distinct frontrunners emerge within their respective operational networks. In the east of the capital, the Docklands Light Railway (DLR) continues to see heavy commercial pressure points centered around the main financial institutions.
TfL’s definitive data chart confirms that Canary Wharf remains the uncontested powerhouse of the light rail system, logging a substantial 6.1 million passengers across 2025. Meanwhile, on the orange-branded London Overground network, the west London retail and residential hub of Shepherd’s Bush pulled comfortably ahead of its outer-suburban peers, recording a leading total of 6.7 million distinct customer interactions at its busy street-level gatelines.
What Does Senior Management Say About the Passenger Growth?
The release of these detailed commuter statistics comes at a time when transport executives are actively justifying long-term capital investments and station capacity expansion projects across Greater London.
As explicitly stated by Alex Williams, the Chief Customer and Strategy Officer for Transport for London (TfL), the organization remains committed to active operational adjustments:
“We continue to deliver a range of measures and improvements across our Tube, bus and rail network to further grow ridership across London.”
How is This Passenger Data Calculated by Transport Experts?
Industry analysts emphasize that the methodology behind these specific transport disclosures provides a far more accurate representation of passenger presence than historical statistical models used before the pandemic era.
The specific data set was brought to light via the Freedom of Information Act (FOI) mechanism. Unlike standard transport reports that often rely on smoothed out annualised mathematical averages or voluntary survey indicators, this specific statistical release isolates actual, raw entry and exit taps recorded by contactless credit cards, smart devices, and Oyster cards at the physical turnstile barriers.
This technical distinction explains the subtle variances found between the competing datasets. For instance, while Tottenham Court Road stands as a giant in direct line-to-street footfall with 63.4 million taps, the alternative comprehensive macro-dataset crowns King’s Cross St Pancras at 72.5 million and Waterloo at 69.8 million as the first and second busiest transport nodes on the overall state-run map, comfortably positioning Tottenham Court Road in a solid third place nationwide.