
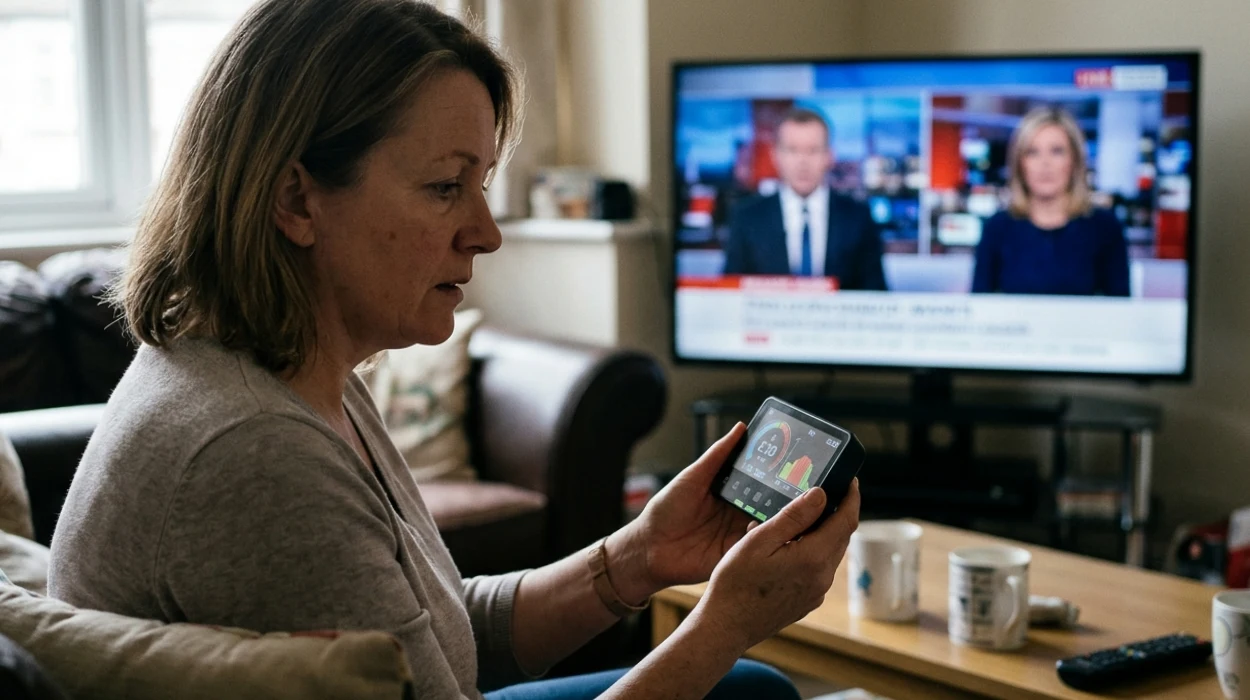
Domestic power usage inside the United Kingdom is undergoing fundamental fiscal changes as structural wholesale markets alter the baseline expenses of daily household appliances. Television units represent a central component of this domestic energy framework, consuming reliable shares of the national grid across millions of properties. This documentation provides an objective, data-backed analysis of television energy use, the current financial landscape, and the underlying regulatory mechanisms establishing consumer electricity expenses in 2026.
- What is the Current UK Television Electricity Cost Landscape?
- Why are UK Electricity Tariffs Rising in 2026?
- How Much Power Do Different Television Technologies Consume?
- What is the Calculation Method for TV Running Costs?
- How Does Standby Consumption Affect Household Electricity Waste?
- What are the Implications of High TV Energy Costs for UK Consumers?
- How Can Consumers Counteract the Financial Impact of TV Energy Rises?
What is the Current UK Television Electricity Cost Landscape?
The financial cost of operating a television in the United Kingdom is determined by the specific wattage of the hardware and the regional per-kilowatt-hour tariff regulated by the Office of Gas and Electricity Markets.
The consumer unit charge for power across England, Scotland, and Wales is legally bound by the regulatory choices of the Office of Gas and Electricity Markets (Ofgem). The executive authority mandates specific caps on standard variable tariffs four times per calendar year.
During the April to June 2026 scheduling period, the baseline national average cost for electricity stands at 24.67 pence per kilowatt-hour (p/kWh). The administrative updates released on May 27, 2026, establish that the baseline unit rate will increase to 26.11p/kWh for the July to September 2026 operational phase. This represents a clear 5.8% increase in the variable cost of electricity per unit, lifting the operational expenditure of all electronic entertainment devices.
A television set draws energy measured in watts ($W$), which expresses the instantaneous rate of power consumption. Energy bills quantify this volume in kilowatt-hours ($kWh$). One kilowatt-hour reflects the continuous deployment of 1,000 watts of electrical energy over a single hour.
Because households use entertainment hardware for multiple hours per day, television operational burdens are closely tied to these shifting price bands. The actual expenditure varies by geographical territory due to network distribution variations. Residents in North Wales and Mersey navigate the highest variable electricity prices at 27.7p/kWh under the Q3 2026 framework, whereas households in the East Midlands encounter lower baseline expenses at 25.1p/kWh.
Why are UK Electricity Tariffs Rising in 2026?
UK electricity tariffs are rising due to increased volatility in international wholesale gas procurement markets alongside structural modifications to national transmission infrastructure investments.
The underlying infrastructure of the British electricity generation grid remains fundamentally coupled to natural gas generation plants. When wholesale gas prices experience sudden inflation, the overall production expense for electrical energy escalates in direct proportion. Wholesalers faced significant procurement challenges in early March 2026 when international market complications induced a short-term doubling of gas futures. Because Ofgem calculates its pricing caps using a rolling backward-looking assessment window, these market shocks materialize in the consumer tariffs announced for subsequent quarters.
Three main pillars dictate the final pricing construct delivered to domestic meters:
- Wholesale Fuel Purchasing: This segment represents roughly 34.63% of the absolute consumer bill weight, serving as the primary source of retail volatility.
- National Grid Distribution Charges: These asset maintenance fees absorb roughly 25.35% of consumer costs to fund regional network infrastructure.
- Environmental Policy Levies: These mandatory payments comprise roughly 15.33% of the bill to sponsor net-zero programs and social support initiatives, such as the Warm Home Discount scheme.
The temporary financial relief experienced by households during the April 2026 price cap reduction down to £1,641 annually for dual-fuel homes stemmed from a targeted government decision to remove specific policy obligations from direct bill charging models. However, the subsequent rebound in wholesale procurement pressures has overridden these adjustments. The energy crisis legacy means that consumer bills under the upcoming July 2026 cap will be exactly 53% higher than the historical baseline figures documented during the winter of 2021/2022.
How Much Power Do Different Television Technologies Consume?
Television power consumption differs based on screen size, integrated display panel technology, and active processing configurations, with wattage requirements ranging from 30 watts to 300 watts.
Modern visual display units utilize specialized methods to generate images, and each methodology places a unique load on household electricity meters. The three primary panel variations found in UK households are Liquid Crystal Displays (LCD), Quantum Dot Light Emitting Diodes (QLED), and Organic Light Emitting Diodes (OLED).
The operational consumption gap between these models stems from their illumination physics. LCD and QLED models utilize a continuous backlight structure that passes light through liquid crystal matrices. OLED panels operate via self-emissive organic pixels that illuminate independently without a central light grid.
The dimension of the display panel scales the base power requirements. This physical expansion can be grouped across three clear marketplace segments:
- Compact Form Factors (32-inch to 43-inch): Standard entry-level LED units pull between 30W and 50W during active video playback.
- Mid-Range Displays (48-inch to 55-inch): Advanced 4K resolution displays draw between 50W and 150W of continuous load.
- Large Format Entertainment (65-inch to 75-inch): Premium cinematic screens demand between 120W and 300W depending on content illumination levels.
The specific brand engineering choice further influences internal efficiency properties. Independent assessments performed by the Consumers’ Association (Which?) confirm distinct operational costs across popular manufacturers. For example, a standard 65-inch LCD model from Philips shows an average running cost of £37.13 per year based on baseline metrics, whereas a comparable 65-inch display from LG records an annual average layout of £31.29. These variations highlight how internal power supply efficiencies can alter energy draw even when external dimensions match perfectly.
What is the Calculation Method for TV Running Costs?
The running cost of a television is calculated by multiplying device wattage by operational hours, dividing by 1,000 to determine total kilowatt-hours, and multiplying that figure by the current regional electricity tariff.
To map out exact financial obligations, households can implement standard mathematical conversions based on physical metrics. The tracking equation for raw energy usage utilizes the direct formula:
$$\text{Power Consumption (kWh)} = \frac{\text{Device Wattage (W)} \times \text{Daily Operational Hours (h)}}{1000}$$
Once total kilowatt-hours are established, the financial cost over a designated tracking window is extracted by multiplying consumption against the prevailing pence-per-unit tariff:
$$\text{Financial Cost (£)} = \text{Power Consumption (kWh)} \times \left(\frac{\text{Ofgem Unit Rate (p)}}{100}\right)$$
Step-by-Step Scenario Analysis for a 150-Watt Television
To illustrate this mechanism under the updated July 2026 pricing guidelines of 26.11p/kWh, consider a high-definition 55-inch display rated at 150 watts that runs for five hours every day.
- Step 1 (Daily Kilowatt-Hour Calculation): Multiply the 150W hardware draw by 5 hours of continuous operation to reach 750 watt-hours per day. Dividing 750 by 1,000 isolates a precise baseline demand of 0.75 kWh daily.
- Step 2 (Daily Financial Calculation): Multiply the 0.75 kWh daily consumption by the tariff rate of 26.11p. This yields an exact daily operating cost of 19.58 pence.
- Step 3 (Monthly Financial Projection): Multiply the daily expense across a 30-day billing month ($0.1958 \times 30$). The monthly operating expenditure for this single screen equals £5.87.
- Step 4 (Annual Operational Projection): Multiply the daily consumption rate over a full year of operation ($0.75 \text{ kWh} \times 365 \text{ days}$). This totals 273.75 kWh of annual grid strain, resulting in a yearly running expense of £71.48.
If the same hardware is evaluated under the older April 2026 tariff rate of 24.67p/kWh, the annual running expense equals £67.53. The ongoing utility price inflation adds an extra £3.95 annually to this single appliance. If a property maintains multiple screens operating concurrently, this financial escalation scales across the household.
Explore More Things To Do
Temple Church and Inns of Court History Walk – Temple
Battersea Power Station: From Coal to Culture – Battersea
How Does Standby Consumption Affect Household Electricity Waste?
Standby power consumption refers to the continuous low-level electrical draw used by modern televisions when powered off via the remote control to sustain background network connections and instant-on features.
The introduction of modern smart capabilities across consumer electronics has transformed the traditional power state into an uninterrupted connection model. When a viewer presses the power button on a standard infrared remote control, the main display panel darkens, but the interior motherboard continues running. This state allows the machine to download firmware updates, interact with home smart networks, and initialize software platforms instantly upon the next user command.
The Ecodesign for Energy-Related Products Regulations set a firm boundary for manufacturers, mandating that base standby power draw must remain under 0.5 watts for standard appliances. However, when televisions are configured with network-connected standby active, this standby draw frequently climbs to between 1 watt and 2 watts.
- A baseline 0.5-watt continuous standby load over 24 hours consumes 12 watt-hours daily. Over a full calendar year, this totals 4.38 kWh of idle power consumption, translating to an annual waste of £1.14 per screen under the 26.11p/kWh price cap.
- A network-connected 2.0-watt standby load draws 48 watt-hours of energy daily. Over 365 days, this expands into 17.52 kWh of unutilized energy grid drain, raising the annual waste to £4.57 per screen.
Across an urban center like London, where millions of screens sit in continuous standby mode, this idle draw compounds into a measurable collective load on national generating infrastructure. Completely isolating the hardware from the wall socket stops this constant parasitic draw.
What are the Implications of High TV Energy Costs for UK Consumers?
The increase in television operational expenses pressures lower-income households, modifies consumer purchasing behavior toward efficient appliances, and drives changes in everyday entertainment habits.
The ongoing growth of utility bills directly influences the discretionary income profiles of UK citizens. Entertainment costs are no longer trivial considerations for families balancing strict financial plans. Lower-income brackets spending extended periods at home, such as pensioners and remote workers, see these micro-expenses consolidate into broader budgetary challenges.
A home running a high-wattage 75-inch cinematic array alongside legacy set-top boxes and separate soundbar accessories can easily generate more than £120 in annual entertainment power bills. This trend prompts consumers to modify how they interact with home technologies.
These cost pressures are driving two main structural shifts across the UK consumer landscape:
- Changes in Everyday Entertainment Habits: Viewers are increasingly using integrated eco-modes, which use ambient light sensors to lower backlight output in dark rooms. This adjustability can cut instantaneous screen wattage by 20% to 40%. Additionally, consumers are reducing background streaming usage, where televisions run solely as background noise.
- Evolving Hardware Procurement Trends: The revised UK energy labeling scale, which rates products from A to G, has become a core element of consumer choice. Buyers regularly bypass poorly rated F or G-class hardware in favor of high-efficiency alternatives to secure multi-year insulation from future utility market volatility.
How Can Consumers Counteract the Financial Impact of TV Energy Rises?
Consumers can lower television energy usage by turning off the main power at the wall socket, activating automatic eco-saving options, lowering panel brightness settings, and utilizing smaller alternative viewing devices.
To limit the impact of rising Ofgem electricity caps, consumers can implement targeted adjustments to lower appliance demands. The most reliable intervention involves terminating the mains connection when a screen is not in active use. Using smart plugs or multi-socket extension switches allows users to cut off power to the television, soundbar, and streaming player simultaneously. This step removes the parasitic standby burden without requiring the physical removal of power cords from hard-to-reach wall outlets.
Internal system adjustment provides another practical path to energy reduction. Most modern manufacturers include pre-configured Eco Configuration Profiles within their setup menus. Selecting these profiles changes the television’s operational behavior by limiting peak luminance and enabling aggressive sleep timers that switch the unit off if no user activity is detected for a set timeframe.
Lowering screen backlight settings helps curb operational costs because driving high contrast levels and bright HDR highlights accounts for a significant portion of an illumination engine’s power draw. Finally, changing viewing habits for basic content can deliver clear savings. Utilizing a secondary low-power tablet or mobile device to listen to news updates or casual streams instead of running a large 200-watt living room television lowers total domestic grid demand and insulates households from rising energy bills.
How much does it cost to run a TV in the UK in 2026?
The cost depends on the television’s wattage, daily usage, and local electricity tariff. Under the July–September 2026 price cap of 26.11p/kWh, a 150W television used for 5 hours per day costs approximately £71.48 per year to operate.