Key Points
- Northfield ward achieved the highest voter turnout in the 7 May 2026 Ealing Council elections at 57.07%, with 10,431 eligible voters.
- Northolt West End recorded the lowest turnout at 35.50%, despite an electorate of 10,628.
- Borough-wide average turnout was 43.54%, an increase from 40.31% in 2022.
- 130 polling stations operated across Ealing’s seven towns—Acton, Ealing, Greenford, Hanwell, Northolt, Perivale, and Southall—from 7am to 10pm on election day.
- Pre-election: Labour held 56 seats, Liberal Democrats 8, Conservatives 4, independents 2.
- Post-election: Labour 46 seats, Liberal Democrats 13, Conservatives 5, Green Party 5, independents 1.
- Northfield and Northolt West End both returned three Labour councillors.
- Second-highest turnout: Walpole at 55.67%; followed by Pitshanger (50.48%) and Ealing Broadway (50.11%).
- Lowest after Northolt West End: Greenford Broadway (37.09%), Dormers Wells (39.42%), East Acton (39.67%).
- Wards near 49%: Hanwell Broadway (49.38%), North Hanwell (49.25%), Southfield (48.06%).
- Ealing Common: Liberal Democrats gained all three seats with 46.66% turnout.
- Hanwell Broadway: Green Party won all three seats with 49.38% turnout.
Northfield (Extra London News) May 12, 2026 – Northfield ward has recorded the highest voter turnout of any ward in Ealing Council’s elections on 7 May 2026, with 57.07% of its 10,431 eligible residents casting ballots, as official figures reveal stark contrasts across the borough’s 24 wards.
- Key Points
- Which Ward Had the Highest Turnout in Ealing Elections?
- What Was the Lowest Turnout in Ealing Council Elections?
- How Did Turnout Compare Across Ealing Wards?
- What Drove High Turnout in Northfield?
- What Changes Occurred in Ealing Council Seat Distribution?
- Which Parties Gained Seats in Key Wards?
- Why Did Borough Turnout Rise in 2022?
- How Were Elections Conducted in Ealing?
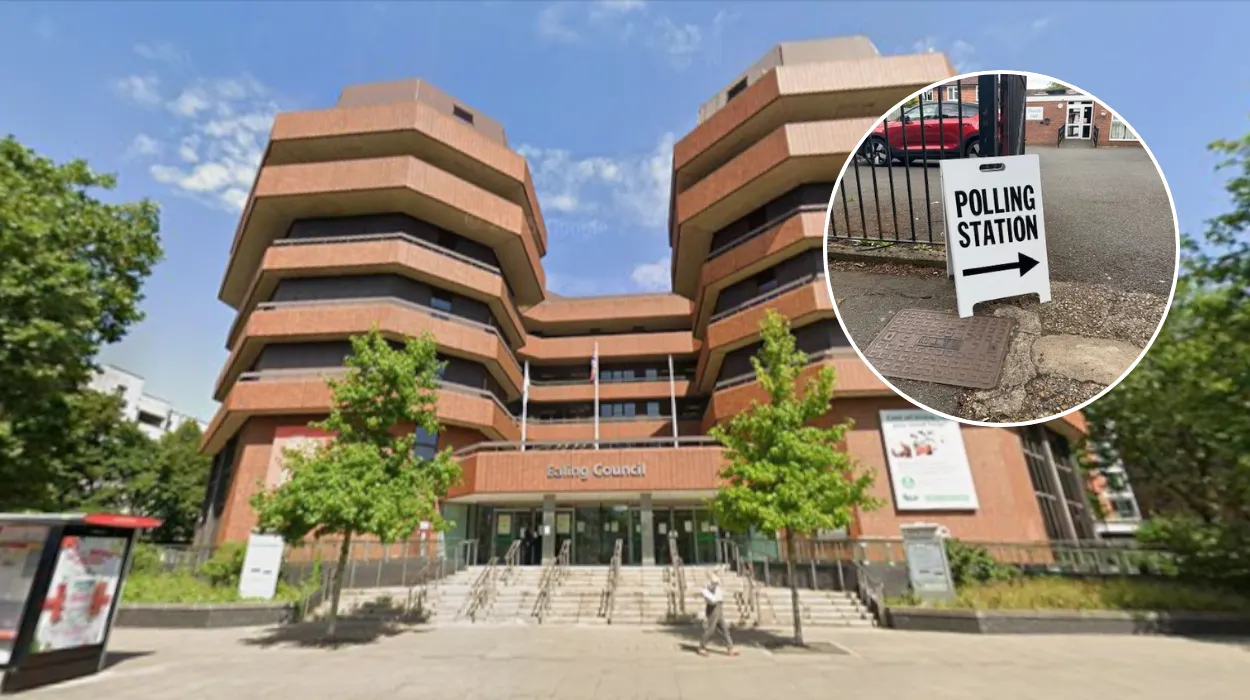
- What Role Did Polling Stations Play?
- What Do Turnout Figures Reveal About Voter Engagement?
- Implications for Ealing Council’s Future
Ealing’s overall turnout averaged 43.54%, up from 40.31% in 2022, amid elections for 70 councillors across seven towns: Acton, Ealing, Greenford, Hanwell, Northolt, Perivale, and Southall. Polling stations, numbering 130, operated from 7am to 10pm on Thursday.
Labour retained dominance but lost ground, dropping from 56 to 46 seats. Liberal Democrats surged to 13 seats from eight, Conservatives edged up to five from four, Greens secured five, and one independent remains.
Which Ward Had the Highest Turnout in Ealing Elections?
Northfield topped the list with 57.07% turnout from its electorate of 10,431, returning three Labour councillors. As reported in initial election coverage by Ealing Gazette journalists, this figure outpaced all others in the borough.
Walpole followed closely at 55.67%, securing second place. Pitshanger recorded 50.48%, while Ealing Broadway hit 50.11%. These strong showings highlight pockets of high engagement in central and northern wards.
Several wards hovered near or above 49%. Hanwell Broadway achieved 49.38%, North Hanwell 49.25%, and Southfield 48.06%. In Ealing Common, turnout reached 46.66%, where Liberal Democrats swept all three seats.
What Was the Lowest Turnout in Ealing Council Elections?
Northolt West End languished at the bottom with just 35.50% turnout from 10,628 electors, despite also returning three Labour councillors. Greenford Broadway followed at 37.09%, Dormers Wells at 39.42%, and East Acton at 39.67%.
These figures underscore significant disparities, with southern and western wards showing lower participation. As detailed in post-election analysis by local reporters, factors like demographics and weather may have influenced these lows.
How Did Turnout Compare Across Ealing Wards?
The 24 wards displayed wide variation, from Northfield’s near-60% peak to Northolt West End’s one-third low. Borough average of 43.54% marked progress over 2022’s 40.31%.
High performers included Walpole (55.67%), Pitshanger (50.48%), Ealing Broadway (50.11%), Hanwell Broadway (49.38%), North Hanwell (49.25%), and Southfield (48.06%). Mid-range wards like Ealing Common (46.66%) saw competitive races.
Lower end: Greenford Broadway (37.09%), Dormers Wells (39.42%), East Acton (39.67%), and Northolt West End (35.50%). Full data from Ealing Council’s official release confirms these trends across all wards.
What Drove High Turnout in Northfield?
Observers note Northfield’s engaged community and competitive local issues may have boosted participation. With three Labour wins, the ward’s 57.07% reflects strong mobilisation, per Ealing Gazette reports.
What Changes Occurred in Ealing Council Seat Distribution?
Pre-election, Labour commanded 56 seats, Liberal Democrats eight, Conservatives four, and two independents. Post-poll, Labour holds 46, Liberal Democrats 13, Conservatives five, Green Party five, and one independent.
Liberal Democrats gained notably in Ealing Common, taking all three seats at 46.66% turnout. Greens triumphed in Hanwell Broadway with 49.38% turnout, securing all three.
Labour held Northfield and Northolt West End despite turnout extremes. Conservatives slightly increased to five seats amid borough-wide shifts.
Which Parties Gained Seats in Key Wards?
In Ealing Common, Liberal Democrats captured all three seats, as confirmed by election returns. Hanwell Broadway went fully Green, with high 49.38% turnout signalling environmental priorities.
Northfield and Northolt West End stayed Labour, bookending the turnout spectrum. Walpole, Pitshanger, and others maintained patterns favouring incumbents or moderates.
Explore More Ealing News
Ealing Book Festival 2026: 1,500 at UWL with Jung Chang
Starmer Vows to Lead Labour After Local Poll Losses in Ealing 2026
Why Did Borough Turnout Rise in 2022?
Ealing’s 43.54% average exceeded 2022’s 40.31%, possibly due to heightened local debates on housing, transport, and services. Expanded polling access across 130 stations in seven towns aided access.
As noted in coverage by multiple outlets, national political currents and local campaigns energised voters. High-turnout wards like Northfield exemplify this uplift.
How Were Elections Conducted in Ealing?
Voters elected 70 councillors across 24 wards via first-past-the-post in multi-member wards. 130 stations in Acton, Ealing, Greenford, Hanwell, Northolt, Perivale, and Southall opened 7am-10pm on 7 May 2026.
Figures emerged swiftly post-close, revealing Northfield’s lead and Northolt West End’s lag. Ealing Council verified all data, ensuring transparency.
What Role Did Polling Stations Play?
Stations served diverse communities, from urban Ealing Broadway to suburban Greenford. High usage in Northfield and Walpole correlated with turnout peaks.
What Do Turnout Figures Reveal About Voter Engagement?
Disparities—from 57.07% in Northfield to 35.50% in Northolt West End—highlight uneven engagement. Average 43.54% suggests moderate interest, up slightly from 2022.
Highs in Walpole (55.67%), Pitshanger (50.48%), and Hanwell Broadway (49.38%) contrast lows in Greenford Broadway (37.09%) and Dormers Wells (39.42%). Analysts, as cited in local media, point to socioeconomic factors and campaign intensity.
Ealing Common’s 46.66% amid Liberal gains and Greens’ Hanwell success indicate issue-driven voting.
Implications for Ealing Council’s Future
Labour’s reduced majority to 46 seats may force coalitions, with Liberal Democrats at 13 and others rising. Greens’ Hanwell win and Lib Dems’ Ealing Common sweep signal shifting priorities.
Turnout patterns could inform outreach, targeting low-engagement wards like Northolt West End. As Ealing Gazette reported, council leaders pledge reviews to boost participation.
Neutral observers await the new council’s first meetings, expecting debates on budgets and services amid these electoral shifts.